
The Relative Strength Index, commonly known as RSI is one of the few indicators that are considered both leading and lagging. Used by both newbies and experts, this indicator has so much to offer and every trader must learn to properly use the RSI indicator and its divergence.
What Is Meant By RSI Divergence?
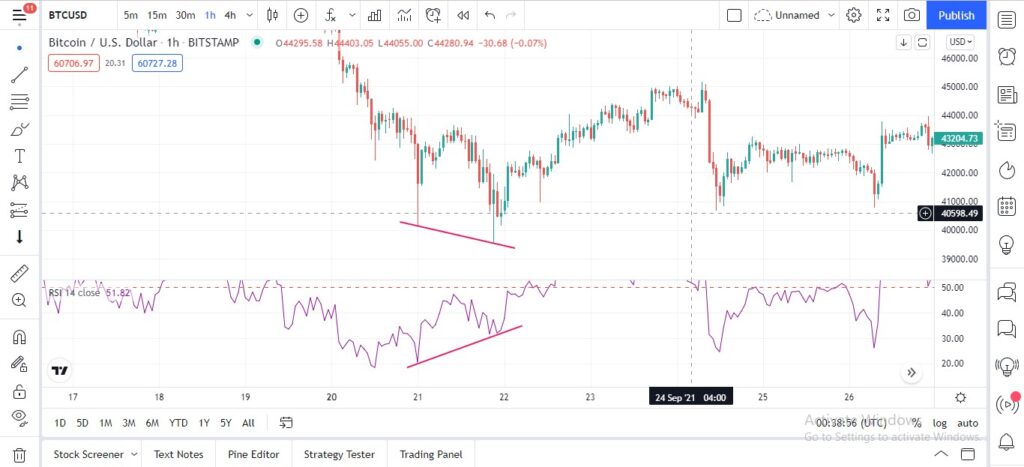
Divergence in RSI occurs when the price of a chart makes higher highs and the RSI makes lower highs or when the price makes lower lows and the RSI higher lows. These situations in the market are referred to as an RSI divergence and play an extremely important role in technical analysis.
First, I will show you a few examples of how a divergence might look like on a chart, and then we will move on to explaining everything that you need to know about the RSI Divergence. Here are a few examples:
What Does An RSI Divergence Tell Us?
You will mostly notice RSI divergence in a trend ie an uptrend or a downtrend. That is because the RSI Divergence indicates trend reversal for short or long.
In simple words, if a market is moving in a certain direction and RSI divergence occurs, that’s an indication that the market might soon change its trend, and start moving in the opposite direction.
How The Divergence Works?
RSI is a momentum indicator which means it measures the strength of the market in different timeframes. The Divergence in RSI then unfolds additional information about momentum/strength. Here’s how:
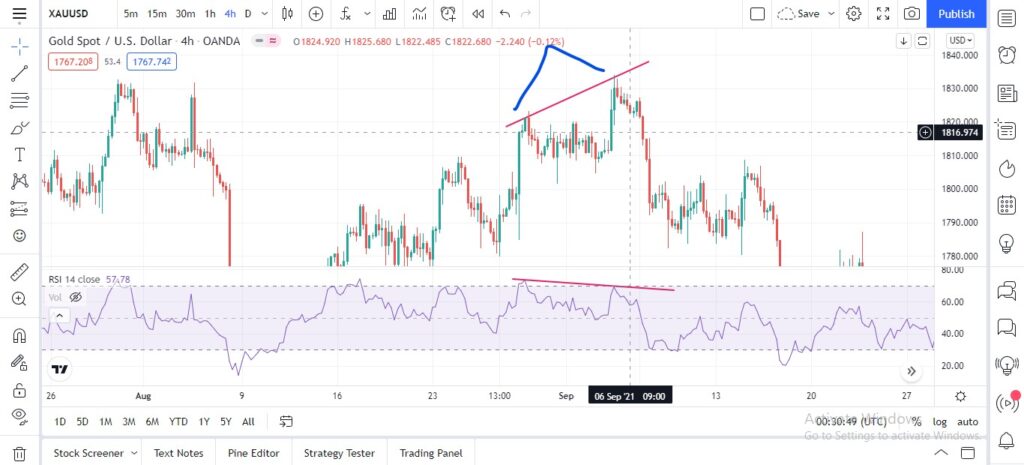
Suppose that a price is moving in an uptrend with higher highs each time and its RSI also generates higher highs. It would mean that whenever the swing highs occur (upside move), the RSI gains momentum which is an indication that the market will continue the uptrend.
Accelerating momentum indicates that we can expect the next swing higher than the current one!
Now, in our next supposition, let’s say this time the RSI generates lower highs. That would mean that with each swing (upside move), the price is losing momentum which indicates a potential breakout toward the downside.
This specific situation in the market is called RSI Divergence and is believed to be a good reversal evidence in technical analysis.

As you can see, in this example, the RSI divergence resulted in a trend reversal and some strong downside movement occurred. Therefore, you need to look for RSI divergence as an additional confirmation tool when trading for reversals.
Can The RSI Divergence Fail?
In trading, there is no certainty which is why even the best of technical analysts have reds on their accounts. RSI divergence is no different and it can fail at times. Treat the RSI divergence as confirmation just like demand/supply zones, moving averages, etc…
Identify divergence on a chart, incorporate it into your analysis, place your stop-loss and take profit, sit back and watch it hit either. Happy Trading!
5 comments
m new trader..how cn i use RSI DIVERGENCE whn m trading boom nd crash
It’s pretty much the same for Boom & Crash Indices. Use timeframes bigger than m30 for accurate results.
HOW TO USE RSI DIVERGENCEIN BOOM N CRASH
I M LERNER
When the pair crosses MA21 in M1 timeframe, shift to M5 timeframe for your next entry from MA21 in M5, which will probably be MA200 in the M1 timeframe.
bro i did not understand this sentence