
Ask a trader how to trade and without a second thought, he/she will start with Support and Resistance Levels. That is because understanding Support and Resistance levels is the key to analyzing the market.
Despite its importance & popularity, there is still confusion amongst traders regarding Support and Resistance Levels such as; should I consider the wick or the body of candlesticks when drawing Support and Resistance Levels? This article explains what to consider & what to avoid while drawing the Support and Resistance lines.
Disclaimer: Trading Futures, Forex, CFDs, and Stocks involves a risk of loss. Please consider carefully if such trading is appropriate for you. Past performance is not indicative of future results. Articles and content on this website are for educational purposes only and do not constitute investment recommendations or advice.
Learn How To Draw Support And Resistance
Throughout this illustration, I’ll use a single trading pair to keep things simple. I choose the Boom 1000, which is a Synthetic Index— highly volatile & respects technical analysis. Let’s get started!

The above is a blank chart of the Boom 1000 Index (H1 Timeframe). Let’s assume that we are going to trade the pair and the first thing we need to do is draw the support and resistance levels. I will first draw the levels and explain why I chose the specific level.
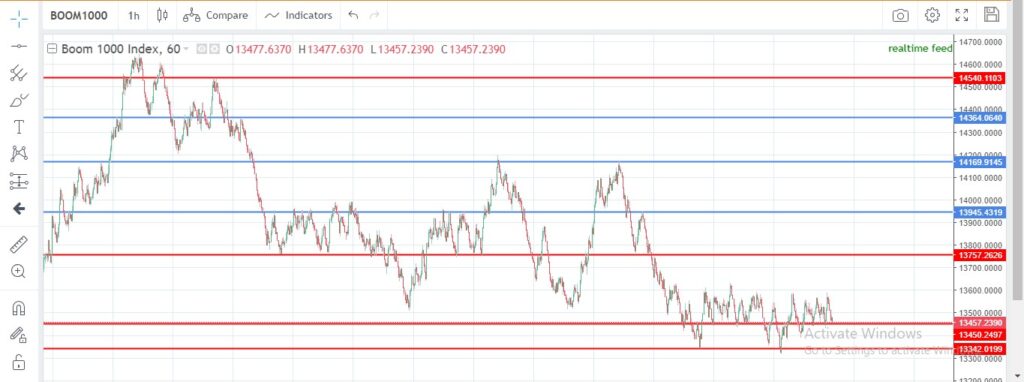
As you can see, I have drawn the levels with the potential to reverse the price. That’s exactly the definition of a support or resistance level. That being said while drawing your support and resistance levels, for starters, ask yourself the following TWO questions:
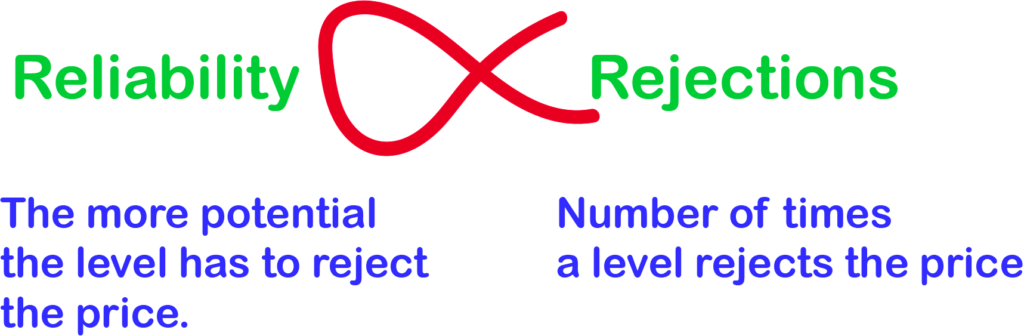
- Is the Support/Resistance level strong enough to reject the price? (Analyze its past behavior, if it has rejected the price at least twice, draw your line. Rejections are directly proportional to reliability here).
2. Can you identify the level without zooming in? The more clearly visible the level, the more reliable it is.
If the answer to both questions is YES, go ahead and draw your support/resistance level. Keep it neat and don’t draw too many levels. A messy chart will more likely confuse you!
Alright, now that you have drawn your support and resistance levels, if you look at the levels closely, you will notice that sometimes, the price is not rejected from a specific support/resistance point but a zone. The price will just roam in the zone for a while and then move in its intended direction. Here’s an example…
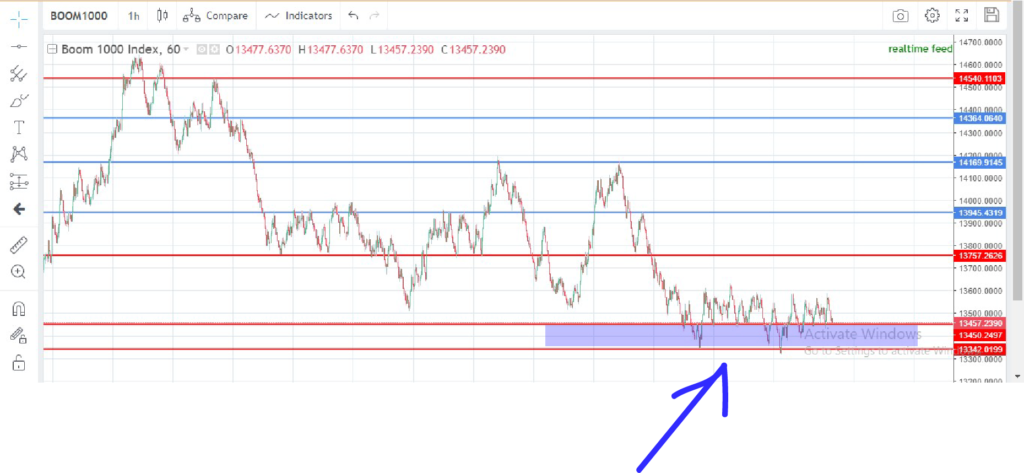
It’s called Support or Demand Zone and is an area with TWO or more minor support levels bordered by a key support level. A key support level is basically strong support meaning that one which has a much higher potential to generate pullback in the market.
That being said, you can expect a strong pullback toward resistance from a demand zone and therefore, you should identify and mark this level on your chart.
That’s it. You now have a basic understanding of drawing support and resistance levels. It’s about time we get into the details!
Drawing Support & Resistance Levels— Key Things To Consider
There are TWO ways to draw support and resistance levels. The Right Way & the Wrong Way. In order to do it the Right Way, we must first understand what’s the Wrong Way.
- Draw as many lines as you can. Push it hard and mark even the minor support/resistance levels.
- Ignore the wick of the candlesticks and focus on the body only while drawing your support & resistance levels.
Instead…!
- Draw only the clearly visible & reliable support and resistance lines. Don’t try too hard, you will draw too many lines and end up having a messy chart.
- The debate “whether to consider the wick or body” needs an explanation instead of a one-liner…
Support And Resistance: Wick or Body of The Candlestick?
This should be one of the most frequently asked questions on the web and there’s no reason it shouldn’t be! Should you consider the wick or the body of candlesticks in order to draw your support and resistance levels properly? Well, here’s your answer…
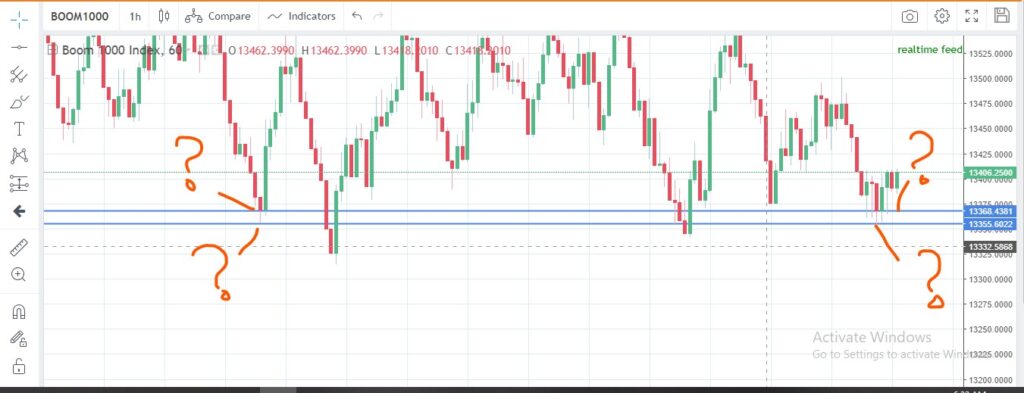
The right answer is: You should consider both the wick and the body of the candlesticks while drawing your levels. Most of the time, the body of the candles closes at a specific point which makes the level a key level of the market. As far as the wicks are concerned, if most of the wicks touch a specific price level and get rejected, it is an indication that the area is a key level and you should draw a line there as well.
Take Away: You should consider both the body and the wick while drawing Support & Resistance levels. Specifically, you will find this situation in bigger timeframes such as H1, H4+…
Learn To Draw Ascending & Descending Support And Resistance Levels
Ascending and Descending Support Levels can be defined as the support and resistance levels of a pair when the pair is following a trend i.e a downtrend or an uptrend.
Here’s what a trend looks like…
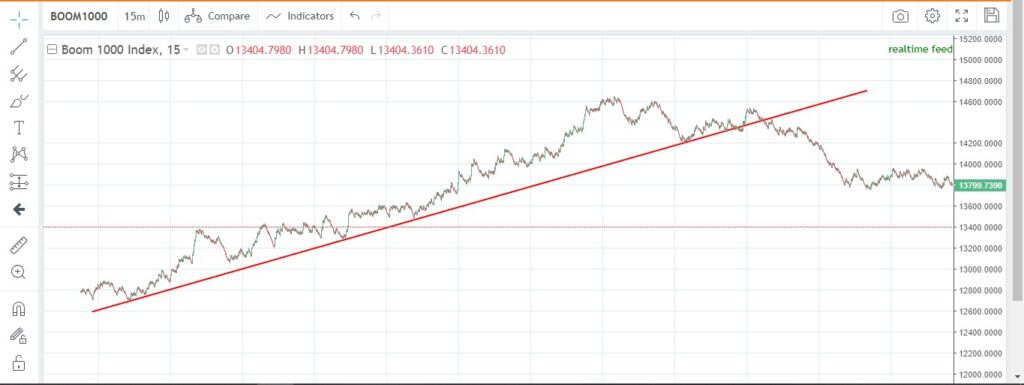
As you can see, the pair is on an uptrend and following an ascending channel. Every time it tests the channel line, gets rejected and continues the uptrend. Therefore, it is a key support level and you should mark it on your chart whenever you see one.
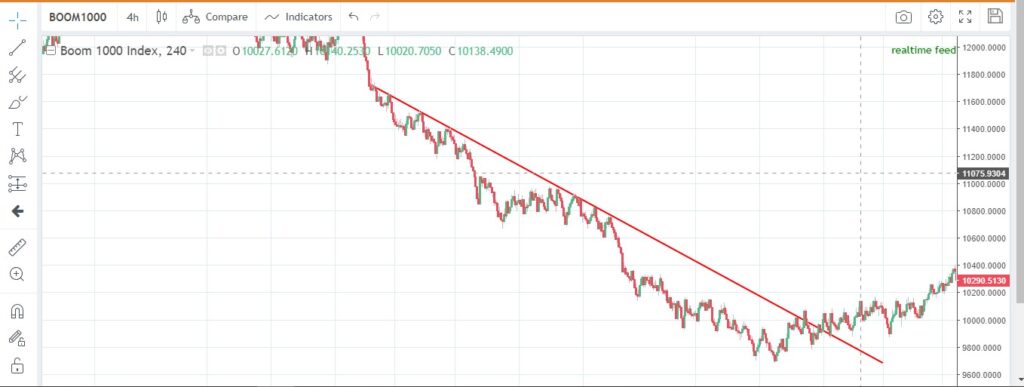
The above is a descending resistance level in a downtrend. Every time the price touches the level, it gets rejected and continues the downtrend.
Please note that these ascending and descending support & resistance levels work with the trend and the moment the trend is changed or it breaks the channel, you should wait patiently for the market to make a new pattern and draw updated Support and Resistance Levels.
Which Timeframe Is The Best For Support & Resistance?
This one is a subjective matter and depends on your style of trading. If you are a Day Trader, M15 and M30 can do wonders for you but if you are a scalper, then using M15 and M30 might not give you satisfying results.
That being said, use timeframes that suit your trading style. If you are a scalper, even M1 and M5 will give you good results and you can make your chart using M1 and M5 timeframes of course considering the bigger timeframes for confirmation.
In the same way, if you plan to take a long trade, there’s no point in worrying over the M1, M5, and M15 timeframes. For long positions, you should consider H1, H4, and even D1, depending on your trading plan. The Bottom-Line is: Choose a timeframe according to your trading style. No timeframe is superior or more appropriate than the other and they all tell stories of their own kind!