
How to use the Boom & Crash Spike Detector?
The Boom & Crash spike detector is an automated spike detecting robot for the boom and crash indices.
Diclaimer: Trading Futures, Forex, CFDs, and Stocks involves a risk of loss. Please consider carefully if such trading is appropriate for you. Past performance is not indicative of future results. Articles and content on this website are for educational purposes only and do not constitute investment recommendations or advice.
If you still haven’t created your own custom Boom & Crash spike detector, read my detailed article on setting up your own boom and crash spike detector.

While you can easily set up the spike detector, using it efficiently is a whole new game. This article focuses on how you can use the spike detector in order to attempt spikes with higher probabilities only.
Boom and Crash Spike Detector User Manual
The boom and crash spike detector can be very complicated at times since it is based on price action and the price action continuously changes. You cannot tell on the face of an arrow whether it is reliable or not. Therefore, you need to thoroughly check and read the data before you place your order.
Here’s the detailed guide on how to use the boom and crash spike detector:
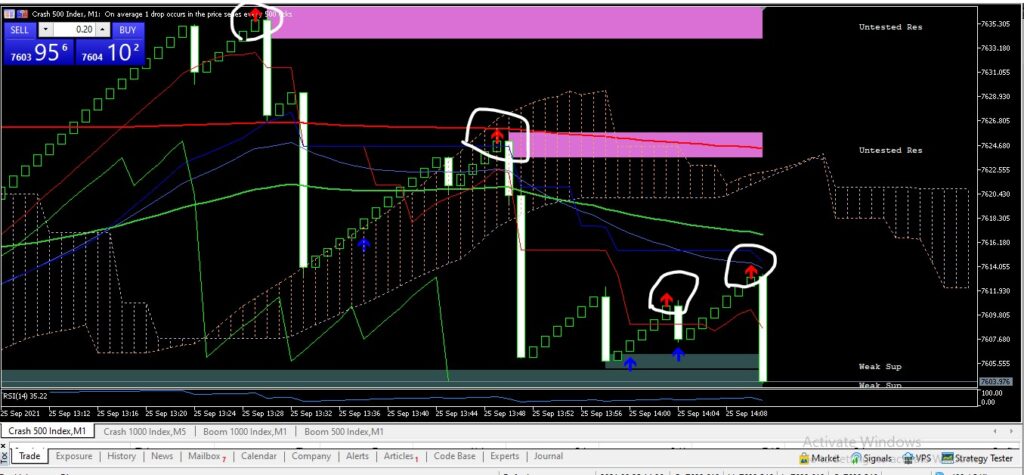
Wait for the Arrow of the Spike Detector
If you have set up your spike detector, you will notice that arrows will appear on your chart indicating an upward or downward movement in the market.
These arrows appear in every timeframe. However, being spike hunters, you should specifically focus on the M1 timeframe since it is the most accurate timeframe for the robot to detect spikes. In simple terms, if the arrow appears on your chart, you should get ready since there is a potential spike entry.
It doesn’t necessarily mean that you should go ahead and place your trade. IT IS JUST AN INDICATION!!
Now, how do you use the indication of the spike detector for an optimal entry? Well, you need to analyze the chart on a few other timeframes and indicators. Here’s how:
Check and Read Indicators’ Data
Though the boom and crash spike detector automatically incorporates the indicators’ data such as RSI reading, you still need to double-check things in order to hunt for reliable spikes only.
There are various ways to check the reliability of spike entries identified by the boom and crash spike detector. To start with, you should always shift into different timeframes instead of solely relying on the m1 or any other timeframe.
Here are the steps that you need to perform in order to assess the reliability of the signal generated by the boom and crash spike detector:
- Check different timeframes on Ichimoku Cloud Indicator: Shift to different timeframes and assess whether it is a good entry as per the Ichimoku Cloud. In the Ichimoku Cloud, you will see different support and resistance levels and they may vary with each timeframe. Basically, the more support or resistance levels you have on different timeframes, the more reliable the entry is. Therefore, avoid signals with fewer Ichimoku indications and focus on the ones with more support and resistance areas on multiple timeframes.
- Check Relative Strength Index: RSI is one of the most accurate indicators when it comes to the boom and crash indices. Always check the RSI reading before you place your order. To give you a general idea, when the RSI floats in the green zone (that’s what I call it), ie when it is below 30 in case of boom indices, and above 70 in case of the crash indices, it is yet another indication of the reliability of the robot’s signal. Here’s how you can set up your RSI levels for more clarity.
- Analyze the Multiple Timeframe Moving Averages: Often times in the boom and crash indices, the spike comes from an exact moving average (I prefer SMA 21, 50, and 200). Therefore, when you get the spike detector’s arrow and the price is about to touch a moving average as well, It is relatively a strong indication.
6 comments
Sir please your indicator shows arrows after the spikes have appeared please help us
How can i get this spike detector
Thanks for this, however the file contains only the resistance and support levels.The arrow alert no longer exist,wish it wasn’t so..
Hi Femi, have you integrated both indicators? I have checked and it works on my MT5. Please check your integrations and let me know.
this indicator is great . your writeup was also very informative, when used as described, it does work.
could you possibly consider adding alerts notifications to this?
Hi Fritz, you can find these additional features in our premium spike detector. For more details, reach out at fahadzar7@gmail.com.