
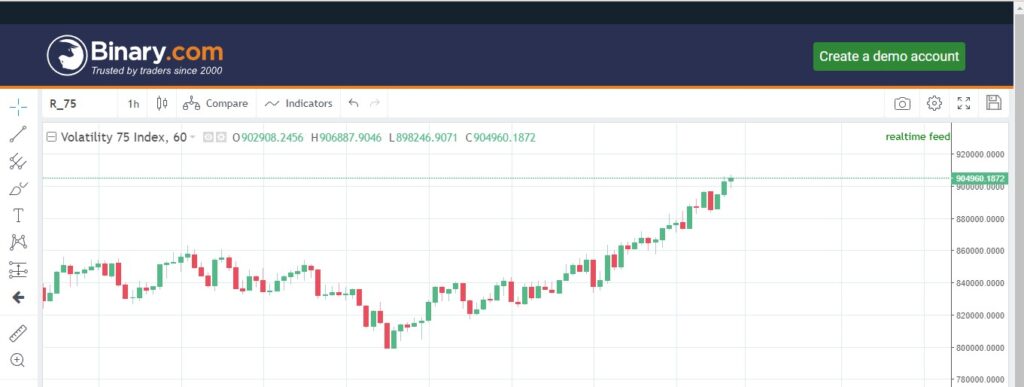
Talk about the most volatile & breathtaking indices and the volatility 75 index, aka VIX75 will always top the list. It can give you the most pleasant or worse trading experience of your life!
Diclaimer: Trading Futures, Forex, CFDs, and Stocks involves a risk of loss. Please consider carefully if such trading is appropriate for you. Past performance is not indicative of future results. Articles and content on this website are for educational purposes only and do not constitute investment recommendations or advice.
It took me almost 2 years to finally understand the mechanism behind the volatility 75 index and the moment I got comfortable trading the beast, I stopped wasting time on other forex pairs. It follows technical analysis more than any other forex pair and with a few smart price-action moves, you can take a fair share from the market.
If you want to learn how to trade the volatility 75 index, read this article till the end and make sure you note down the key points. I have also shared my video in which I grew a $308 account to $1000 in just 2 days merely trading the volatility 75 index.
If you want to follow my VIX75 strategy, please read the article in detail and if you have any questions, you can leave a comment below.
What Is the Volatility 75 Index?
The volatility 75 index is basically an index that measures the level of risk in the market. It is a real-time indicator of the risk and just like other trading pairs, it follows a pure technical pattern meaning that you can trade the volatility 75 index by performing technical analysis.
The index does not have any major fundamental drivers such as monetary policy, interest rates, consumer price index, etc…
That being said, it is a purely technical pair and if you are good with your charts, you can make huge returns trading the volatility 75 index.
Since it is highly volatile, I recommend you don’t trade it until and unless you have sharp technical skills and your equity is big enough to support the level of risk involved in VIX75.
The question is; how much equity do you need to trade the volatility 75 index? Well, it depends on your trading style. If you are someone who loves to trade with lower lot sizes like 0.001 and 0.002, then any account with $100+ equity is good for you. However, if you plan to scalp the volatility 75 with bigger lot sizes to catch those quick pips, then the recommended minimum equity is $1000.
The higher your equity for volatility 75, the better it is.
Let’s Talk About the Lot Size
It is extremely important to understand the mechanism of lot sizes in the volatility 75 index. You might have traded pairs like XAUUSD, GBPUSD, or Boom & Crash pairs and lot sizes like 0.5 or 1 will be pretty normal for you.
Don’t even think about applying 1 lot size to the volatility 75 index until your equity is 100,000!
Like every other pair, the lot size in the volatility 75 index depends on the size of your account. Generally, if your equity is lower than $200, you should use the minimum lot size that is 0.001. $200+ Equity Holders can use lot size bigger than 0.001 but not bigger than 0.003. If you have a $1000+ account, you are good to use a lot size between 0.003-0.008.
In addition, it also depends on where you plan to place your stop-loss. You are allowed to use a relatively bigger lot size if you plan to place your stop-loss closer and the farther your stop-loss is, the smaller your lot size should be.
Pro-Tip: Always test the lot size on a demo account first to observe how it would feel on your real account. If it gives you a go-ahead, then go ahead. This will help you manage your risk effectively.
How to Trade the Volatility 75 Index?
Alright now that you have the basic know-how of the volatility 75 index, let me talk about some of the strategies that you can use to trade VIX75.
Pullback & Reversals
A pullback or reversal is the sudden price reversal in trading pairs. Being a strong follower of technical analysis, the volatility 75 index can give impressive results on the pullback strategy.
To trade pullbacks & reversals, draw support & resistance levels on your chart. If you don’t know how to draw the levels, read my detailed article on how to draw support & resistance levels. OR, you can use the Ichimoku Cloud indicator that automatically detects support and resistance levels.
Here’s how you can draw your support & resistance levels.
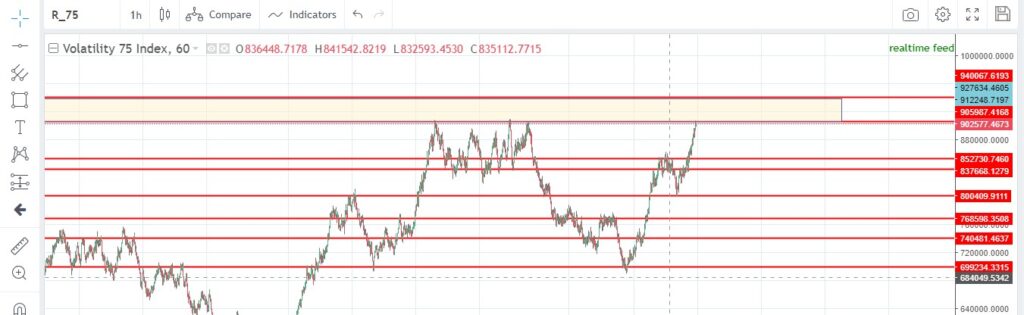
Once your draw support and resistance levels, wait for the price to test on a level. If the price approaches resistance, sell the volatility 75 right at the resistance level and place your stop-loss just above the level. Generally, the resistance will more likely reject the price and as a result, pullback.
The focus here is to catch that pullback and grab a few quick pips. Remember that for this strategy your stop-loss will be close and you would need to use a relatively bigger lot size than you use normally.
In addition, don’t be too optimistic and always have a stop-loss. A single wrong move can result in blowing up your account.
The Moving Average Method
Personally, I prefer the moving average indicator over all other indicators. I have been using the moving average indicator for over 4 years now and it has never disappointed me. Like every other pair, the moving average gives impressive results in trading the volatility 75 index.
To trade VIX75 using the moving average method, you need to apply 3 moving averages from the indicators window. For volatility 75, I recommend smoothed moving averages 21, 50, and 200.
| Moving Average | Color | Method |
| 21 | BLUE | Smoothed |
| 50 | GREEN | Smoothed |
| 200 | RED | Smoothed |
Once you have applied the 3 smoothed moving averages, the next step is to learn how to trade the volatility 75 index using these moving averages. Here’s how to take your positions using the moving averages:
Moving Average Pullback: When the price is about to touch a moving average, you can expect a strong pullback/reversal meaning that you will be trading against the trend. It’s a bit risky but it works amazingly well in lower timeframes such as m15 and m30. Use a relatively bigger lot size and place your stop-loss right above or below the moving average.
Once the price reverses, bring stop-loss to the entry point, and this way, you will eradicate the risk. You can then close the position in profit as per your risk-reward ratio or if an opposite rejection is expected. Let me explain:

As you can see in the above m30 timeframe of VIX75, whenever the price touches a moving average, it reverses most of the time. If you check other timeframes, you will notice that it follows the moving averages perfectly.
Sometimes, the price might break into the moving average and reverse back after hitting your stop-loss. Yes, like every other trading pair, stop-loss hunting exists even in the volatility indices. Here’s my detailed article on how to avoid stop-loss hunting.
I have also tested the moving average method for day & swing trades and am quite amazed by the results. To analyze the market for a daily or weekly position, use relatively bigger timeframes such as h1 and h4. However, do not solely rely on moving averages for long-term positions and always look out for supporting evidence such as trendlines, supply & demand zones, etc… (explained below)
VIX75 RSI Divergence
Relative Strength Index (RSI) divergence is another great way to trade the volatility 75 index. Add the RSI indicator to your chart and set RSI levels 10,20,30,50,70,80,90. Here’s how you can add levels to the RSI indicator.
Watch a video instead:
Once you add the RSI indicator to your VIX75 chart, analyze the chart in different timeframes using other trading strategies like moving averages, support & resistance zones, etc…
If there’s confirmation from other strategies, the next step is to assess its RSI. You should not rely solely on RSI indicator and just use it for additional confirmation. If the RSI is below 30 in a timeframe, it would mean that the market should go up at least a bit and if the RSI is above 70, it would mean that the price will more likely come down a bit. However, it can be tricky at times and the RSI will stay up or down even for days. Therefore, use it for additional confirmation only and do not buy or sell just because the RSI is above 70 or below 30.
Another way to use the RSI indicator is to look for RSI divergence. RSI divergence is simply when the candlesticks make higher highs but the RSI makes lower highs. OR, when the candlesticks make lower highs and the RSI makes higher highs. To understand this, here’s an example:
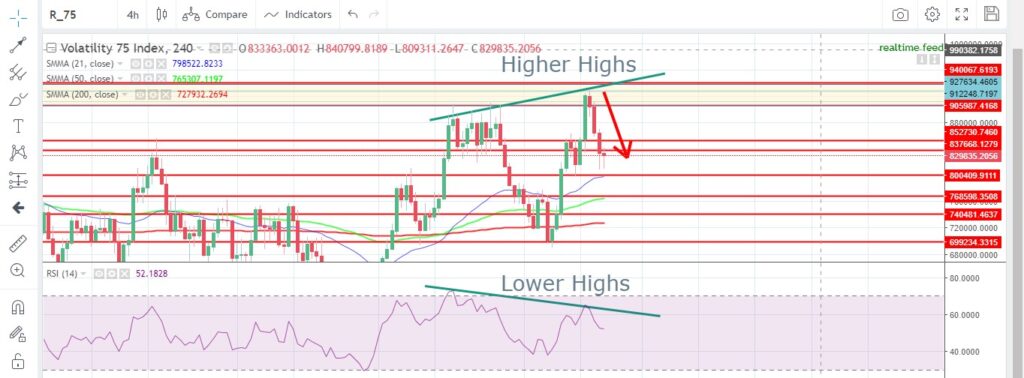
As you can see in the above volatility 75 chart, the market was going up smoothly but reversed soon after the RSI divergence happened.
When RSI divergence happens, the price reverses. Let’s suppose that if the price is going up and RSI divergence occurs, it would indicate that the market is going to reverse and the price will most likely come down. Likewise, if the market is going down and RSI divergence occurs, it will result in the market going up. To know more about the RSI divergence, I recommend you read my detailed article on RSI divergence strategy.
Volatility 75 & the Ichimoku Cloud
I have recently started using this indicator and am already in love with it. It’s an amazing FREE indicator and works pretty well for volatility indices including the volatility 75 index.
Go to the indicator list and type in “Ichimoku Cloud”. Add the indicator to your chart and here is how to use it:
Scalping (use the m5 or m15 timeframe): When the VIX75 is on an uptrend and the price comes down in the range of the Ichimoku cloud, buy and place stop-loss below the Ichimoku cloud zone. Keep the TP at least twice your stop-loss or close manually when it reaches a decent profit level.
In the same way, when the pair is in a downtrend, sell when it is about to touch the Ichimoku zone above and place your stop-loss right above the Ichimoku Zone.
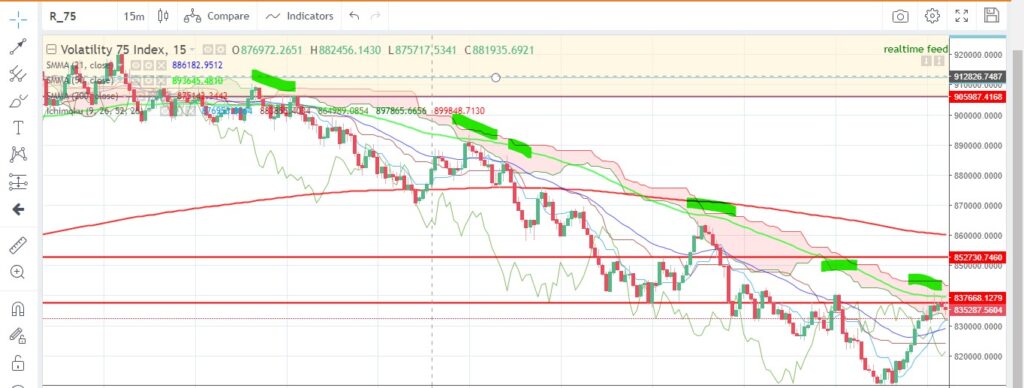
As can be seen, whenever the price touches the Ichimoku zone, it fails to penetrate and comes down to continue the downtrend.
Day & Long Trades (H1 and higher timeframes): You can also use this indicator for day trades and long-term trades. Adopt the same strategy and it will work out its magic. I recommend you use it alongside other indicators such as RSI, moving averages, and demand & supply zones for long-term trades as you need more than a single confirmation because of the more capital involved.
These are some of the tested strategies that I have personally used to trade the volatility 75 index. However, I would still recommend you to first try my strategies on a demo account instead of your real account to ensure that they work for you.
Final Thoughts on VIX75
Using these strategies, I have grown many small accounts merely trading the volatility 75 index. Here’s a video in which I managed to grow a $308 account to $1008 in 2 days only, that too by trading 2-3 hours a day. The account is $4000+ as I write this article. The point is that volatility 75 is the pair that can give you the happiest trading sessions of your life if you get to understand the psyche of the pair.
Best of luck for your next trading session and if you have any questions, please feel free to ask in the comment section or send me an email.
41 comments
Which broker do you recommend trading the VIX75?
Hi Mike, I recommend Deriv for volatility indices.
Merci de nous avoir partagé votre stratégie, alors dite nous ce quoi le Time frame approprié pour cette stratégie ?
Hi Michael, can you please translate that into English!?
Michael says, “thank you for sharing your strategy with us, which time frame is most appropriate for the strategy?”
That depends on your trading style and account size. Generally, if you want to scalp, then use m5, m15, and m30 timeframes (Check ALL for confirmation). However, for the normal day trading, I recommend h1 -sometimes h4, to understand the bigger picture. Hope it helps!
Bonjour mon expert,
Je remarque que la configuration “smooth” dans Moving averege n’est pas disponible sur deriv. Que faire?
Hi, can you please translate that into English!? 🙂
Hello my expert,
I notice that the “smooth” configuration in Moving averege is not available on deriv. What to do ?
Hello there, Kennedy!
It is available on both PC and Mobile Deriv MT5 platforms. Go to indicators >> Moving Average >> Properties >> Method >> Select>Smoothed.
If you are having issues setting up your moving averages, refer to my articles on the Boom & Crash indices where I have explained how to set up your moving averages. Alternatively, you can watch my video on setting up a custom spike detector that requires the use of moving averages: https://www.youtube.com/watch?v=3hfBgMbcJts&t=136s&ab_channel=EconomicGrapevine
I hope it helps 🙂
Hello expert,
Well received, I’ll try the configuration and I’ll get back to you.
Thank you
You are welcome. Happy Trading!
Use MT5
Is there any whtsapp or telegram group for guidline…
Please I would like to know the settings for Ichimuku could settings both on PC and Mobile please 🙏🙏
Hi, Ability!
Here’s my Ichimoku Cloud settings:
Tenkan-sen: 9
Kijun-sen: 26
Senkou Span B: 52
No Fill
I hope it helps.
Sir, How to utilize Tenkan-sen and Kijun-sen? Can both provide signals?
Is there any whtsapp group or telegram for guideline
Hi Mohsin,
You can reach out at fahad@economicgrapevine.com for further assistance.
CAN pls make a video version of this article showing how to setup the indicators and using them in real-time chart? 🙏
Hi James! We do upload videos on our youtube channel. The volatility 75 index trading strategy will be soon shared in video form. Here’s the link to our youtube channel: https://www.youtube.com/channel/UCwOy468cfjIcaoIdIpe1VSw/playlists
Happy Trading!
Sir how accurate is the moving average method?
Basically, it can yield great results even in isolation if you simply trade with the trend. However, while trading against the trend, you should read other indicators’ data along with price action.
In addition, use bigger timeframes for moving averages while trading highly volatile pairs such as the volatility 75 index since fake moving average breakouts are pretty common due to its aggressive style. I hope it helps 🙂
what happens between the up and down movement of SMA 200
When the price is below the SMA 200 level, you should expect it to further go bearish until and unless you have a strong reason to believe that the market will reverse. Likewise, when the price is above the 200 SMA level, it will most likely continue the bullish trend. I hope it helps 🙂
hi sir….do you also do account managements?
hello.
I have question about the volatility 75. where can get the robot for that? and how cam work with this volatility 75. you can help me please about this
Hi, Mike!
Please send me an email at fahad@economicgrapevine.com and I will help you set up your custom robot for the VIX75 index.
Deriv is not available in my country and I have contacted a few top brokers now but cannot find any offering vix75, any suggestions?
Hi Simon, you can reach out directly via WhatsApp for assistance. There are various alternatives and my team will guide you on how to start trading the VIX75. You can find contact details in the footer of the website.
Hi. Fadar. I wish to thank you very much for your patience and support. Your help will take us far with Vix 75 profitable strategy. I wish you all the best in your trading endeavour.
Hi fadar. I am Phakiso Kheleli from Lesotho. My email is pkheleli6@gmail.com. I wish to thank you very much for your patience and support in our trading journey. I can see that you are taking us to the new heights with Vix 75 profitable strategy. I wish you all the best in everything you touch
Hello there Phakiso, thank you for appreciating the efforts that I’ve put in. Comments like these motivate me to share more of what I’ve learned throughout my trading journey. I wish you best of luck for future endeavors as well and hope to see you in our membership program!
hi sir..do you also do account management?
Hi Gilbert, please reach out at fahadzar7@gmail.com for assistance
sir, please explain how to use the moving average when trading with the trend,you explained only how to use it for pull backs strategy.thank you sir
Can I apply pinball strategy to the volatility 75 index?
Yes Laiba. You can apply any strategy as the VIX75 follows the rules of technical analysis. However, be careful with the lot size since it can be stubborn at times.
Thanks so much for this infos you dole out here. Please I would appreciate if you can help with the moving average indicator settings.
Hi there! Could you please specifically explain what you are struggling at?