
Boom 1000 is one of the four unique synthetic indices offered by Deriv. Boom 1000 along with Boom 500, Crash 1000, and Crash 500 are unique indices due to the spikes, which is the sudden boom and crash in its price. In this article, I will focus on how you can trade the Boom 1000 successfully.
Boom 1000 is well known for its volatility and is a great way to grow your trading account. The high volatility also means that you can incur big losses if you don’t follow the rules and play it rough. That is why you need to understand a few things before you start trading the Boom 1000.
Disclaimer: Trading Futures, Forex, CFDs, and Stocks involves a risk of loss. Please consider carefully if such trading is appropriate for you. Past performance is not indicative of future results. Articles and content on this website are for educational purposes only and do not constitute investment recommendations or advice.
As a starter, here is what you need to know about Boom 1000.
- Boom 1000 and Crash 500 are highly volatile pairs as compared to Boom 500 and Crash 1000.
- The Boom 1000 can easily cross 500 pips movement in a single day. No kidding!
- It’s a 100% technical pair which means it follows and respects the rules of technical analysis (chart analysis) and price action.
- The Spikes of Boom 1000 are the largest among other pairs and the sudden boom could easily be 20-60 pips.
So, how do you trade the Boom 1000 index? What are techniques that work and what to avoid while trading the Boom 1000? This article explains it all.
How To Trade Boom 1000?
First, let me show you a snapshot of my trading history and explain why I like to trade the Boom 1000. (Excuse my trading setup for now. I will explain it at the end of this article.)
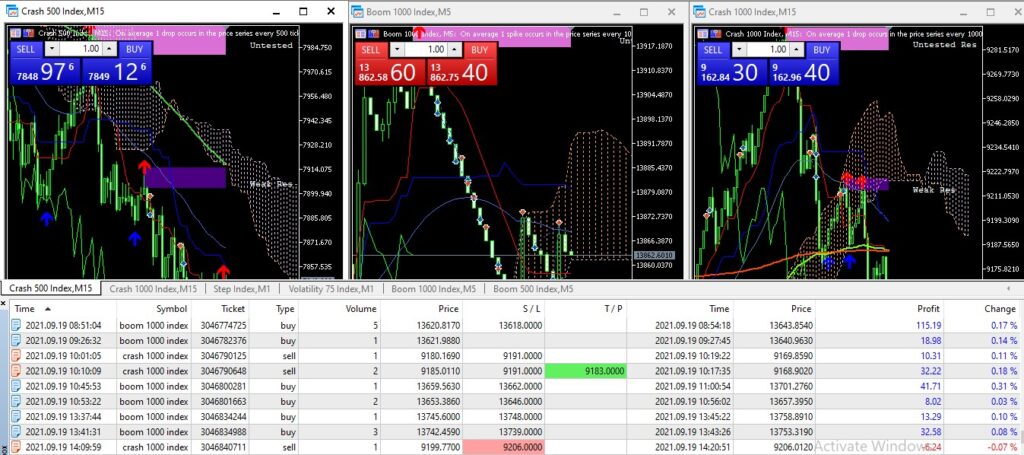
As you can see, Boom 1000 seems to be my favorite pair and there’s no reason I shouldn’t like it. It perfectly follows technical analysis and other price action strategies but I specifically prefer it due to its long & lucrative spikes.
Most traders trade the Boom 1000 to catch a spike or a series of spikes. These spikes can give you maximum return in no time if you implement the following rules and trade with discipline. Here is how you can trade the Boom 1000 index.
1. Apply Moving Averages
Whenever you need life advice, you consult with a friend or a person you can trust. In the same way, before you start trading, you should apply moving averages to the pair. I have applied & checked a lot of moving averages throughout my trading journey and have identified the ones with accurate results.
For Boom 1000, I recommend THREE smoothed moving averages with lengths 21, 50, and 200 respectively. Make the 21 moving average blue, and the 50 green, and apply the red color to 200. Here is the step-by-step process of adding these indicators to the Boom 1000.
Step 1: Go to Binary and open the Boom 1000 chart. Add Smoothed Moving Average indicator by clicking indicators and selecting Smoothed Moving Average indicator.

Step 2: Click on the setting icon and set the length to 21. The source should be “close” by default and you would leave it as it is. Go to style and color it blue.
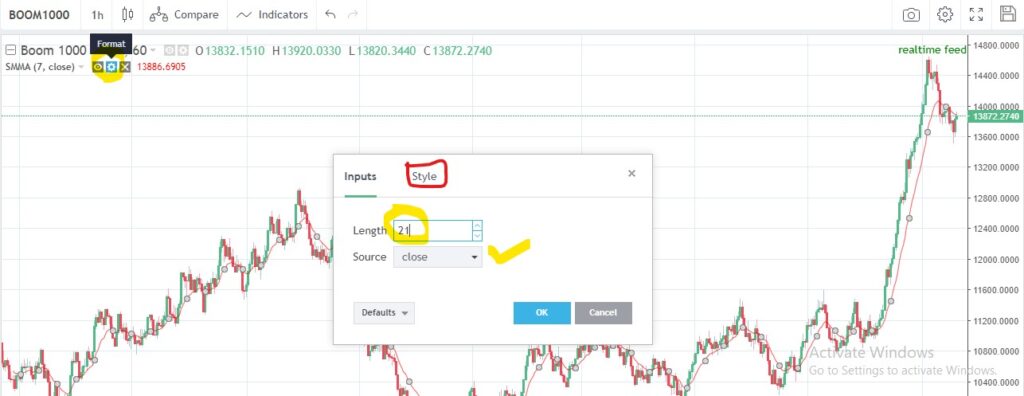
Step 3: In the same way, add another smoothed moving average. Set the length to 50, and color it green. Repeat and make the third one red with length of 200. Congratulations! you have successfully added the required moving averages.
2. Draw Your Support & Resistance Levels
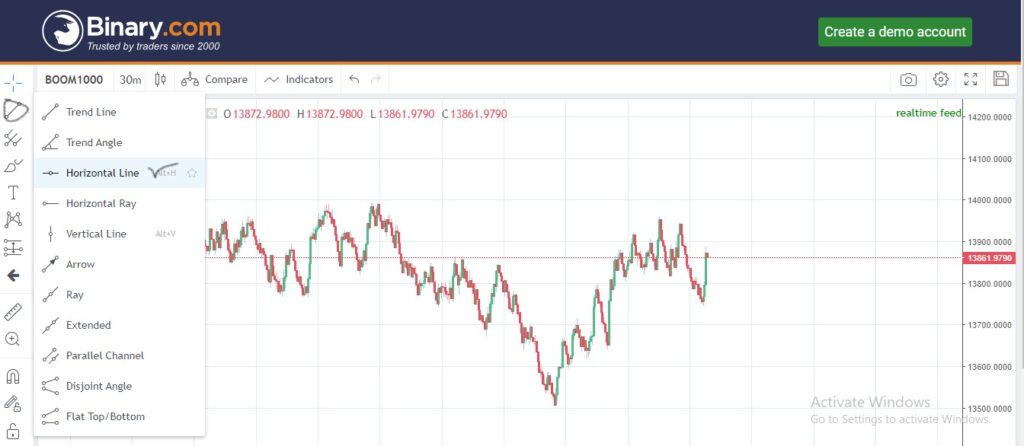
This one is extremely important and you shouldn’t leave any stone unturned while drawing levels in the market. Open the Boom 1000 chart and select Horizontal Line.
Next, you need to draw support & resistance levels. Don’t overthink the levels and draw the reliable ones only. For the level to be considered reliable, it must reject the price at least twice or thrice. Here is how you can draw the support & resistance levels of Boom 1000.
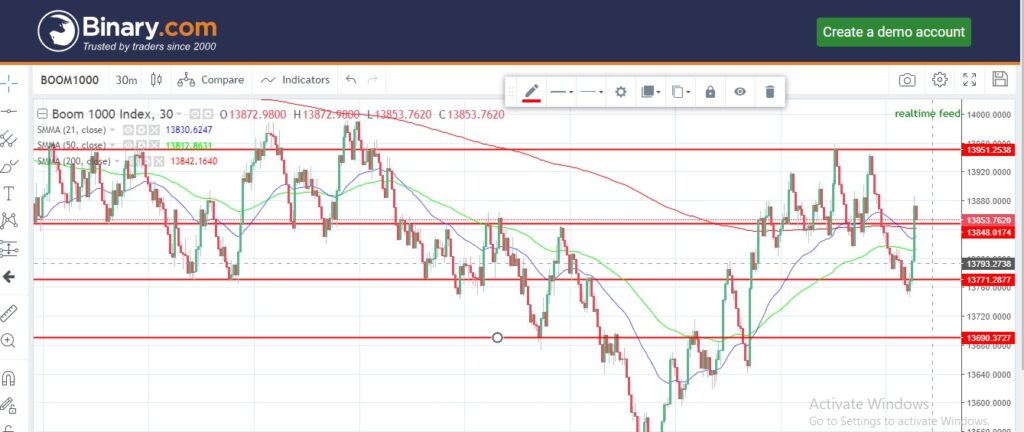
As you can see, I have only drawn the clearer and more obvious ones. These levels are good entry points and will increase your success probability. Tip: Don’t make a mess of your chart and keep it neat and accurate.
If you are uncomfortable with drawing support & resistance levels, you can use the Ichimoku Cloud indicator that does the job for you.
In addition, you should identify patterns like double bottoms, double tops, ascending & descending wedges, head-and-shoulders, triangles, etc to have an in-depth understanding of the market.
3. Catch The Boom 1000 Spikes
To catch a spike or a series of spikes, you need to understand the mechanism behind a spike. Why does a spike arise in the Boom 1000? Well, as you already know the Boom 1000 moves in the downward direction with each M1 candle and gets rejected at some point which results in a spike.
The spike arises due to one or more than one of the following reasons.
- The price has touched a support level.
- The price has arrived at a demand zone.
- The price might be at a trendline support.
- The price is about to get rejected by a moving average.
- Relative Strength Index (RSI) Rejection
Let’s explain each of the above reasons and incorporate them in trading the Boom 1000 index.
1. Support Level
Once you draw your support & resistance levels, you should wait patiently for the market to test at your level. It’s noteworthy to mention here that a lot of traders incur huge losses thinking they would miss on a spike.
Yes, you will miss a lot of spikes and that will make you regret reading my article. In my defense, it will develop patience in you, which is one of the key personality traits a trader should have. As a result, keeping you in line with institutional traders and outplay most of retail traders.
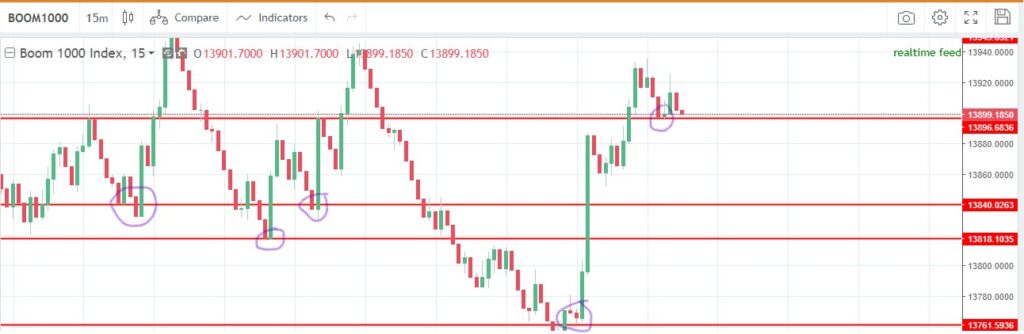
Below is the chart of Boom 1000 that clearly shows how the price gets rejected most of the time at support levels. That being said, you can set your buy limit at the exact support level with a tight stop-loss. While putting a stop-loss, you should consider:
- Risk/Reward Ratio: Don’t risk $100 on a single position if you aim for a $50 profit. If an average spike gives you 100$, you shouldn’t risk more than $50. In other words, follow a minimum of 1:2 Risk/Reward Ratio.
- Price Action: When the Boom 1000 is on an uptrend, it will probably follow & respect every support out there but in a downtrend, it just doesn’t get tired of breaking them. Make sure you perform some price action analysis to make sure the trade is worth taking. Preferably, in a downtrend, you should rely on strong support levels only such as daily, weekly, monthly, or trendline supports.
- Consistent Rejection: If the price gets rejected from a support level more than twice, chances are that it’s getting ready for some lucrative spikes. When the Boom 1000 is down, don’t try for long trade unless you find evidence. The evidence could be a double-bottom, difficulty in breaking support etc…
2. Demand Zone
The demand Zone is the price level where traders and investors on the sidelines are willing to step in and buy when prices get that low. A demand zone basically acts as a support level. For example, if the weekly support of Boom 1000 is, let’s say, 12,000 and the price suddenly comes down to 12,000 from 12,500. Many traders would want to buy the Boom 1000 as it is a psychological buying zone. Hence, resulting in a strong pullback toward resistance.
Here is how you can draw a demand zone for the Boom 1000 Index.

As you can see, whenever the price hits the demand zone, it gets rejected with pressure. At this point, most traders buy the Boom 1000 which results in a sudden hike in the price.
That being said, you should identify & draw demand zones along with support & resistance levels to have a much better view of the market. A support level that lies in the territory of the demand zone is more likely going to generate a spike in the Boom 1000, hence, you can use a decent position size.
3. TrendLine Support
Trendline supports are ascending or descending support levels depending on the trend of the market. Below is an example of trendline support in the Boom 1000 Index.

As you can see, whenever it touches the trendline support, it gets rejected most of the time and generates spikes. Always have a stop-loss depending on your position size and risk/reward ratio because the price can break out at times,
4. Moving Averages
Once you set up the moving averages 21, 50, and 200, it’s time to get surprised by its amazing results. Moving averages work best on almost all timeframes when the Boom 1000 is on an uptrend. Let me show you a few snapshots of moving averages applied to Boom 1000 that might intrigue your interest!


This is the Boom 1000 H1 timeframe that clearly shows how the moving averages reject the price from breaking in. You can find the moving averages rejections in all timeframes.
To trade with moving averages, you need to first identify the trend of the market. A clear uptrend is when the MA 21 (Moving Average) is above the MA 50 and the MA 50 is above the MA 200. If this is the case, the market is in a clear uptrend and you can expect further upward movement in the market.
Whenever the price comes down, you can attempt to catch a spike from a moving average in different timeframes with a stop-loss right below the moving average or below the closest support, depending on how much risk you can afford to take.
For example; When the price comes down to MA21 in the M15 timeframe, you can place your buy order with stop-loss right beneath the MA21. If it rejected the price, great! If not, wait for it to test on MA50, which would probably be MA21 in the m30 timeframe. You will notice that the more moving averages the price faces in different timeframes, the higher the chances of rejection.
5. RSI Rejection
Relative Strength Index or commonly known as RSI is a momentum indicator that measures the magnitude of recent price changes to evaluate overbought or oversold conditions in the market.
RSI rejection works in almost every time timeframe when it comes to the Boom 1000 when in an uptrend. When the RSI comes below level 30 in an uptrend, that’s buying evidence. However, you shouldn’t rely merely on RSI because the Boom 1000 could become stubborn at times and will push the RSI into the breaking zone.
If you’re like the many traders who trade using a smartphone, here’s the best RSI setting for MT5. (Setting explained below)

As can be seen, the rsi 20-30 rejects the price most of the time even in the M1 timeframe. If you observe it on other timeframes, you will notice the same. Hence, RSI is also strong evidence and you can expect a spike in the Boom 1000 on RSI rejections.
Here’s how you can set up the above RSI setting for the Boom 1000 index:
- Go to indicators and add Relative Strength Index to your chart.
- Set the period of RSI “14” and apply to “close” if not by default.
- Now, go to levels and add levels 10,20,30,50,70,80, and 90 and add a description accordingly.
- Lastly, go to style and change the pixel to “2” to make the lines evident.
- Click “Done” and your settings will be saved.
Related: RSI Divergence
Boom 1000 Spike Catching Strategy
Now that you know the mechanism behind spikes, let me share a simple Boom 1000 spike-catching strategy with you. Before you go and test this strategy on your real account, I encourage you to test it on a demo account to make sure it works for you.
RULES
- No Chart, No Trade: Take your time analyzing the market, and don’t start in a haste.
- Place your Stop-Loss wisely: Be brave yet realistic with your stop-loss.
- Don’t just trade for Spikes: Look out for potential long-term positions.
- Know when to go big with Boom 1000: Use a decent position size (lot) in high probabilities and tight stop-losses.
- The market isn’t going anywhere: Wait patiently for entry points.
- Don’t let the reds scare you: The reds (loss) will turn into blue in the span of a second.
These rules generally apply to all synthetic indices. Here is my detailed article on key rules for trading synthetic indices.
Trading Boom 1000 is more of an art and to become a good artist, you need to consider even the tiniest of details. These details could be the reaction of the market to a specific price level (price/action), momentum changes, rejections, etc…
To trade the Boom 1000 successfully, you need to be patient and realistic. The Boom 1000 can act like a stubborn child at times and can wash you up in a single day. That is why you have to have a stop-loss based on your risk/reward ratio and equity.
Enough of prerequisites, let’s now start off with our strategy.
First thing, observe the trend of the Boom 1000. If it’s in an uptrend in most of the timeframes, only then should you attempt to catch spikes. This will increase the probability of winning trades.
Alright, now that you have your Boom 1000 index chart decorated with moving averages, supports, and RSI, let me explain how you can set up your entries.
When the Boom 1000 is on an uptrend and the price comes down to MA 21 in the M1 timeframe and the RSI is about to test 70, you should look for support nearby, if there’s support, you can attempt to catch a spike from the MA21 with stop-loss right beneath the support level. Ideally, you should place the stop-loss some 2-3 pips below the support to accommodate for the spread and stop-loss hunting.
Once the price crosses the MA21 in the M1 timeframe, shift to the M5 timeframe and wait for the price to test MA21 in the M5 timeframe which probably will be MA50 or MA200 in the M1 timeframe. That should be your next entry point with a stop-loss below the MA21 or closest support.
In the same way, you can attempt to catch a spike when the price arrives at MA21 in M15, M30, H1, and H4 timeframe. Note that higher timeframes have strong chances to reject the price hence resulting in a series of spikes but you need to be a bit brave with your stop-loss as the rejection might not occur from the exact moving average line and sometimes, the price may break-in in order to hunt stop-losses or simple to retest the nearest support.
That being said, the moving averages of higher timeframes like M30, H1, and H4 have much better results than lower timeframes like M5 and M1. In the same way, D1 and W1 can give you surprising results and can turn out to be potential long-term positions.
Below is a snapshot of the Boom 1000 M15 timeframe that shows how perfectly Moving Averages work.

As you can see, sometimes, the price breaks in and bounces back from nearby support. Whenever the price breaks, don’t play rough with your stop-loss and wait for it to retest a moving average or support in a higher timeframe such as M30 or H1.
What If It Stops Working?
Like every other trading strategy, this strategy will not work at times especially when the Boom 1000 is in a downtrend or some strong price/action event has occurred. In that case, you would need to have a cup of coffee and wait patiently for entries.
The best way is to wait for the market to test at trendlines, weekly or monthly supports or moving averages in higher timeframes. Do not take on unnecessary trades in between and save your equity & energy for the next trading session.
Best of luck with your next pip hunt!
35 comments
Awesome, i am excited about the strategy. It seems to work
This is good idea I benefit on this.
Bonjour excusez-moi moi les 3 moyennes mobiles qu’il faut ajouter sur boom 1000 chez Binary est il possible de l’ajouter a mt5 sur mon phone ?
Oui M. Natanhhkk, il est possible d’ajouter les moyennes mobiles à l’aide du mt5 de votre téléphone. Allez simplement dans le panneau indicateur et ajoutez 3 moyennes mobiles. Définissez chaque valeur moyenne mobile et profitez de votre trading !
Si vous avez besoin d’une aide supplémentaire pour votre trading Boom & Crash, pensez à m’envoyer un e-mail à fahad@economicgrapevine.com
Bonjour
Vous avez de l’expérience dans les robots ?
Qu’est que vous en pensez?
Merci
AG
Oui, j’ai de l’expérience avec les robots et nous proposons également des robots de boom et de crash personnalisés. Si vous êtes intéressé par nos services premium, contactez fahad@economicgrapevine.com pour plus d’assistance. Passe une bonne journée!
Good information thank you
Now I fully understand how boom works thank you alot
Thank you so much for your strategy explanation, god bless you Sir
You are welcome. Happy Trading 🙂
Sarwar Alam from Karachi
03322399588
Add me WhatsApp
Sir do you advise to sell on boom and buy on crash?
Until and unless you have mastered the rules of price action, it is not advisable to sell boom and buy crash indices.
Sir there are many indicators you’ve shown us even on the YouTube video but I don’t understand how you can combine the spike indicator plus the rsi plus moving average plus ichimoku. Should we use the spike detector plus moving averages only?
The main thing is that you should be able to read the price action of the pair. Indicators help understand price action. Yes, you don’t need to apply every single indicator that I have explained. Simply, check what works for you and what doesn’t.
Espectacular,
Excelente explicação, se pudesses adicionar alguns vídeos para suportar a sua explicação acho que seria de bom grado!
Parabens
Interesting lecture thanks v much
You are welcome. Happy Trading!
This opened my eyes today…im kind of new in trading so this seriously blew my mind i now understand some concept in boom 1000
Thnk u very much
Glad to hear. You are welcome. Happy Trading!
this seems to be very interesting ,at this point in time i think i should focus on the boom index to see if i will make changes in my trading experience…..thanks alot sir for the lectures
Yes, you should focus on one pair at a time. The Boom 1000 is highly volatile and you can easily reach your monthly target by merely trading the Boom 1000 Index. For more strategies that work on the Boom 1000 and other synthetic indices, please refer to our other articles and youtube videos. Goodluck!
I really love this information.
May you remain blessed.
I’m glad you found it helpful. Happy Trading, John!
Hello Sir
Thanks for the good article
but i need help in finding smoothed average movement in the indicators because i only find 3 which are
Moving Average (MA)
Moving Average Envelope
Rainbow Moving Average
Thanks
Hello Mr. Zaidan, thank you for appreciating the efforts!
Basically, the smooth moving average is a variant of the moving average indicator. Some trading platforms don’t have it but that’s totally okay you can use the simple one. Please refer to my other trading articles for an in-depth understanding of the moving average.
Cheers,
Il faut combien un minimum de combien de Dollars $ pour débuter avec Le trading sur Boom 1000 ??
Merci
This is by far the best explanation of trading the boom 1000 index thank you so much! Love from South Africa <3
Nice strategies for boom 1000 really appreciate you taking time and explaining everything. One question please: Is there any other broker (other than deriv.com) for boom 1000 and other boom crash indices?
INFINIMENT MERCI POUR CE CADEAU À LA VALEUR INESTIMABLE
De rien. Merci d’avoir visité mon blog. Si vous avez des questions ou avez besoin d’aide concernant l’indice Boom 1000, n’hésitez pas à laisser vos commentaires ou à nous contacter directement.
thanks boss its working .
can you give me a crash trategy With RSI
You have made my trading profitable with the rsi strategy. It works for me well. God bless you
I’m glad it worked for you. Happy Trading!